Electron’s main process exposes few useful module for BrowserWindow to debug or profiling its behavior. contentTracing is one of them provides binding to Choromium’s Trace api allows to profile BrowserWindow without manual recordings. It is similar to modules like Lighthouse or Speedracer does internally to profile pages via Chrome browers.
contentTracing quick overview
If you open up about://tracing(or chrome://tracing depends on version) on Chrome browser you can see UI of Trace event profiler Chrome provides by default. contentTracing and this UI internally users same profiler api, means you can get most of Chrome browser’s Trace profiler results via contentTracing. Electron’s documentation provides simplest example to record profiling.
import { app, contentTracing } from 'electron';

if (!app.isReady()) {
  throw new Error('cannot record trace until application is ready');
}

// Default profiling options
const options = {
  categoryFilter: '*',
  traceOptions: 'record-until-full, enable-sampling'
};

contentTracing.startRecording(options, () => {
  console.log('Tracing started');

  setTimeout(() => {
    contentTracing
      .stopRecording('', (path) => console.log(`Trace recorded at ${path}`));
  }, 5000);
});
This example records traces for 5 seconds using default category (pick all available category via categoryFilter: '*') and prints out saved trace path. Electron itself doesn’t provides UI to load profiling result so load up those via about://tracing will shows profiling results of processes.
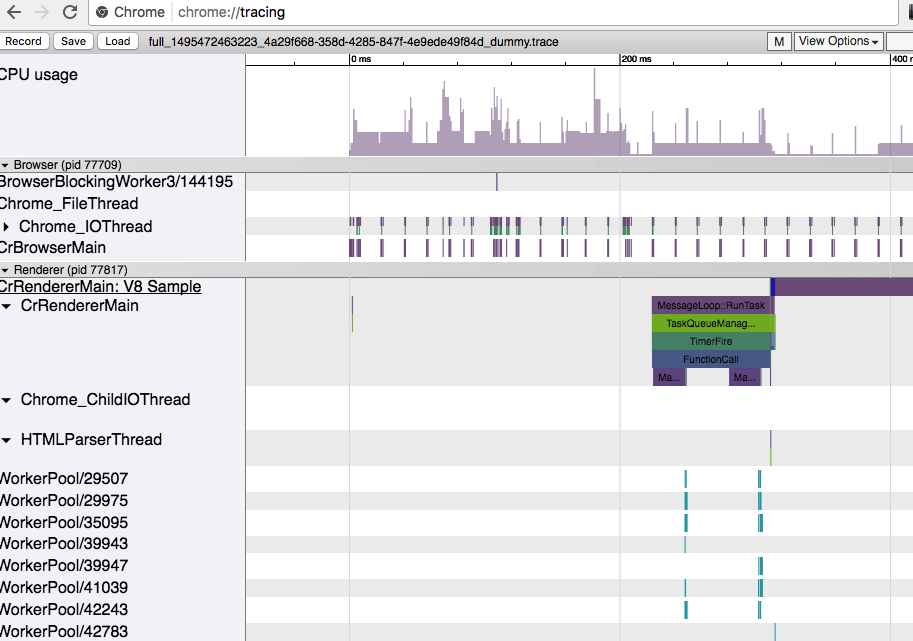
Trace results shows profiling all processes.
The reason you can get only most, not all of trace results compare to Chrome trace is due to difference of category support. contentTracing doesn’t support all of categories in Chrome’s trace and all unsupported categories configured in option will be ignored and will not be included in trace results. Electron has contentTracing.getCategories interface to allow query currently supported categories.
Use Trace profiling results in devTools
Profiling results written by contentTracing and Chrome Trace Profiler is JSON blob following Trace Event Format. And also, Chrome devTools profiler in Timeline(recently rename to Performance) tab uses same format for profiling as well. In latest Chromium actually both profiler uses same Trace api with different configuration only. In short, result created via contentTracing is compatible to devTools Timeline profiler and devTools can load it.
But while loading trace result itself works there are some differences between profiling result recorded via devTools directly. First, depends on structure of Electron application if it has multiple BrowserWindow, devTools probably will not pick up exact process you’d like to see. Secondly, with default category most of user Javascript stack is not profiled.
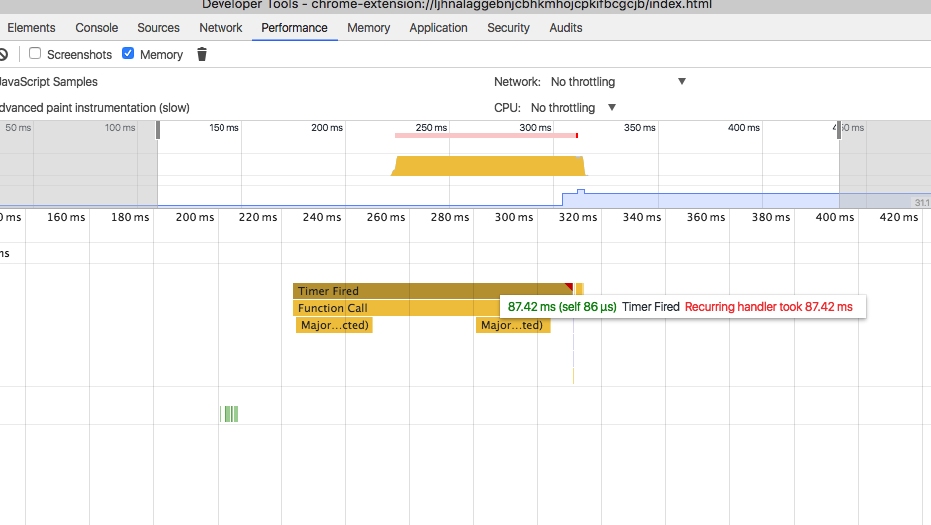
Trace results with default categories in devTools. User JS stack is not displayed.
First issue is due to Chrome Trace profiler’s behavior. Devtools are intended to display results of specific process currently connected and does not provide way to select certain processes. In opposite Trace runs profiling over all processes. To display specific process profiling results need to be filtered out to exclude all uninterested process behavior. Trace Event Format describes detailed structure of each trace instance, simple one looks like this.
{"name": "Asub", "cat": "PERF", "ph": "B", "pid": 22630, "tid": 22630, "ts": 829}
Among those properties pid indicates process id of this trace event. Simply delete all trace events other than main process’s pid and process would like to observe, then devTools will display result of specific process correctly.
User code stack issue can be resolved by simple configuration. Trace profiler’s default profiling category is * wildcard to pick up all available categories but this still does not picks up category under disable-by-default. Stacks and other expensive profiling categories are under those so it should be specified manually. Inspect source of devTools UI itself allows to see what kind of categories are specified for timeline profiling and it can be used contentTracing as well.
// Setting custom category to get stack traces
const defaultTraceCategories: Readonly<Array<string>> = [
    '-*', 'devtools.timeline', 'disabled-by-default-devtools.timeline',
    'disabled-by-default-devtools.timeline.frame', 'toplevel', 'blink.console',
    'disabled-by-default-devtools.timeline.stack',
    'disabled-by-default-v8.cpu_profile', 'disabled-by-default-v8.cpu_profiler',
    'disabled-by-default-v8.cpu_profiler.hires'
];

const traceOptions = {
    categoryFilter: defaultTraceCategories.join(','),
    traceOptions: 'record-until-full',
    options: 'sampling-frequency=10000'
};

contentTracing.startRecording(traceOptions, ....);
Now contentTracing will collects similar result to manual profiling via devTools timeline.
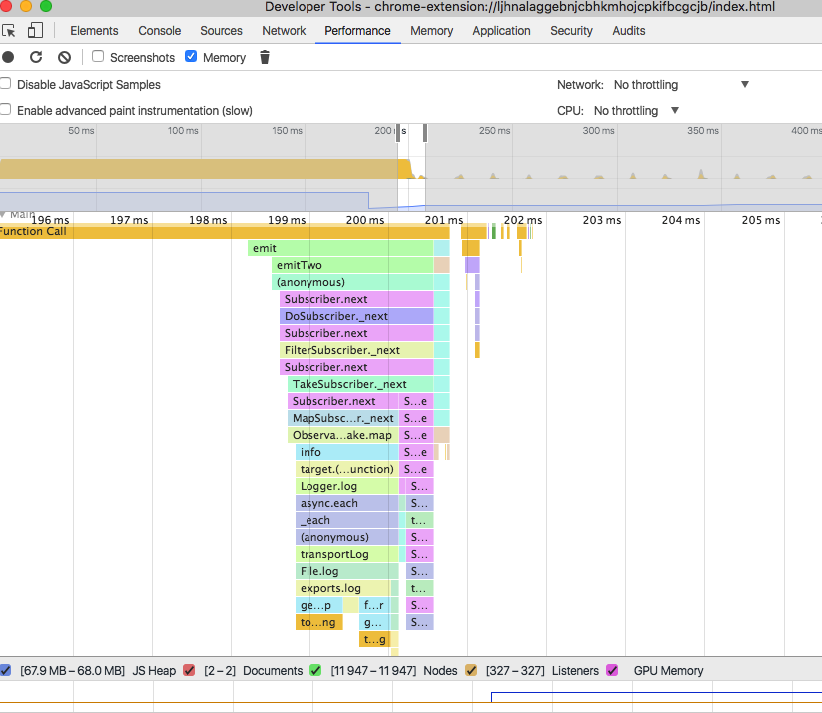
After filtering out process and specifying custom category.
Chaining with CPU usage monitoring
From v1.6.9 Electron provides additional interface to monitor application status in detail. process.getCPUUsage is one of them allows to capture usage of CPU over time. Below is simple example chain it with contentTracing.
// Capture percent of CPU usage over given period
const getPercentCPUUsageForPeriod = (period: number) =>
  Observale.of(0, period)
    .mergeMap((x) => Observable.of(x).delay(x))
    .map(process.getCPUUsage)
    .pluck('percentCPUUsage')
    .takeLast(1);

// Run profiler for given duration and returns saved path
const getTraceRecord = (recordDuration: number,
                        recordOptions: { categoryFilter: string }) => {
  const start = Observable.bindCallback(contentTracing.startRecording);
  const stop  = Observable.bindCallback(contentTracing.stopRecording);

  return Observable.concat(
    start(recordOptions),
    stop().delay(recordDuration)
  ).takeLast(1);
};

const traceOptions = { categoryFilter: '*' };

// If CPU usage over 15% around 10 sec, run profiling for 3 sec
getPercentCPUUsageForPeriod(10000)
    .filter((threshold) => threshold > 15)
    .mergeMap(() => getTraceRecord(3000, traceOptions))
    .subscribe((path) => console.log(`Trace recorded at ${path}`));
getPercentCPUUsageForPeriod runs getCPUUsage subsequently for given period to capture percent of CPU usage and getTraceRecord runs profiler for given duration. In example snippet it captures CPU usage around 10 sec then run profiler if it exceed 15%. In actual implementation instead of recording directly all time, could use contentTracing.startMonitoring to capture trace in buffer and selectively save it if necessary.