Electron 1.7 introduced v8 inspector protocol added in node.js 6.3. This protocol replaces legacy debugging protocol in node.js, allows to debug Electron’s main process via v8’s inspector protocol. Since Chromium uses same protocol for its devTools, now Electron can have seamless debugging experience between main process and renderer process. Simply run Electron with --inspect command argument and open given url in Chrome, now devTools will open up pointing main process code.
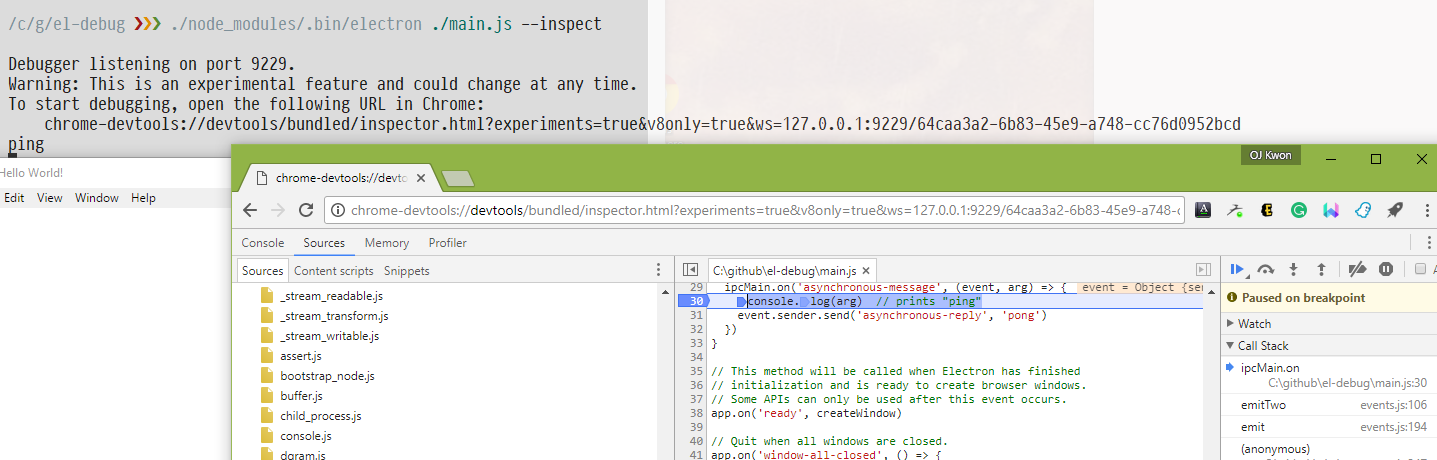
Able to set Breakpoint main process code in devTools
This is good enough, but if you’re using VS Code as editor you can get better debugging experience with new protocol. VS Code debugger supports Multi-target debugging which allows to run debugger for server / client simultaneously. It could be used for Electron as well.
First, setup debugging task for main process.
{
   "type":"node",
   "request":"launch",
   "name":"Electron Main",
   "runtimeExecutable":"${workspaceRoot}/node_modules/.bin/electron",

   "args":[
      "${workspaceRoot}/main.js",
      "--remote-debugging-port=9333" //Set debugging port for renderer process
   ],
   "protocol":"inspector" //Specify to use v8 inspector protocol
}
Only need to set few things includes setting runtime executable to Electron, specify debugging port for renderer process, and lastly setting protocol to v8 inspector protocol is required.
Then setup debugging task for renderer process.
{
   "type":"node",
   "request":"attach",
   "name":"Electron Renderer",
   "protocol":"inspector",
   "port":9333
}
It’s plain process attach task, but notable thing is it is still using node.js debugger instead of VS Chrome debug extension. If you’re attaching already launched Electron process Chrome debug extension also would work, but currently in case of compound task for multi-target debugging Chrome debug extension can’t connect renderer process properly. Internally both uses same core, so no major differences.
Lastly, setup compound task to launch two tasks simultaneously. Launching this task will spawn Electron, and attach debugger into renderer process and allows to debug between two processes.
"compounds":[
   {
      "name":"Electron",
      "configurations":[
         "Electron Main",
         "Electron Renderer"
      ]
   }
]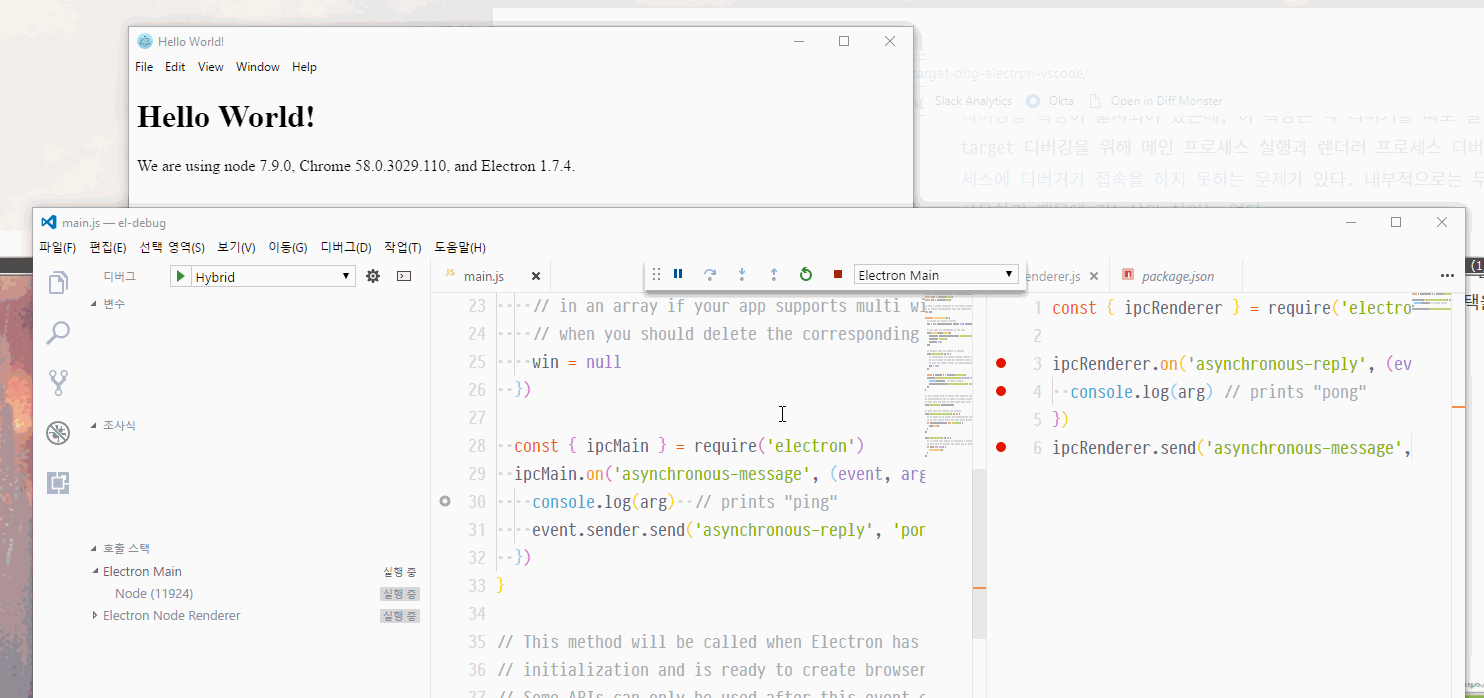
Can trace both processes stack and Breakpoint seamlessly
Technically this was able to using legacy debugging protocol (using legacy with pre-1.7 Electron) but using new protocol makes easier configuration, especially things like source map support in Electron-prebuilt-compile.